
Monitoring tools are good at sending alerts and bad at saying what to do first. After a busy night you have twelve emails, three Slack threads and a dashboard of green and red dots — and you still have to work out which one matters, which domain it is on and where in the tool you go to fix it.
DNS Toolbox now puts every serious problem in one list, in two places: the dashboard’s Needs you, across all your domains, and the What to fix list on each domain’s overview. Each item says what is wrong in words and carries the button that fixes it, or opens the screen where it is fixed. This guide shows both, and what the buttons do.
What lands in the list
- Sites and monitors: a site that is down, and since when; a monitor blocked by a firewall or failing; a page that turned slow.
- Mail: a domain or its sending server on a blocklist, DMARC failing or its reports stopped, hosted SPF in trouble, spam complaints over the line.
- Certificates and domains: a certificate within 14 days of expiring, a registration within 30, a DNS change that never spread.
- WordPress: every serious item a connected site reports — its critical findings and vulnerable plugins, signs of a break-in, email that stopped working, WP-Cron that stopped, and a site that cannot be read.
Worst first. Configuration gaps that are not urgent — a DMARC policy still at p=none, say — stay on the domain’s own page rather than crowding the dashboard. An item leaves the list by itself when the next check finds the problem gone, and when nothing is left the card says All clear.
Step 1: Start at the dashboard
The dashboard opens with Needs you. Each row has an icon for its area, what is wrong and why, the domain, its workspace, how long it has been going on, and one or two buttons:
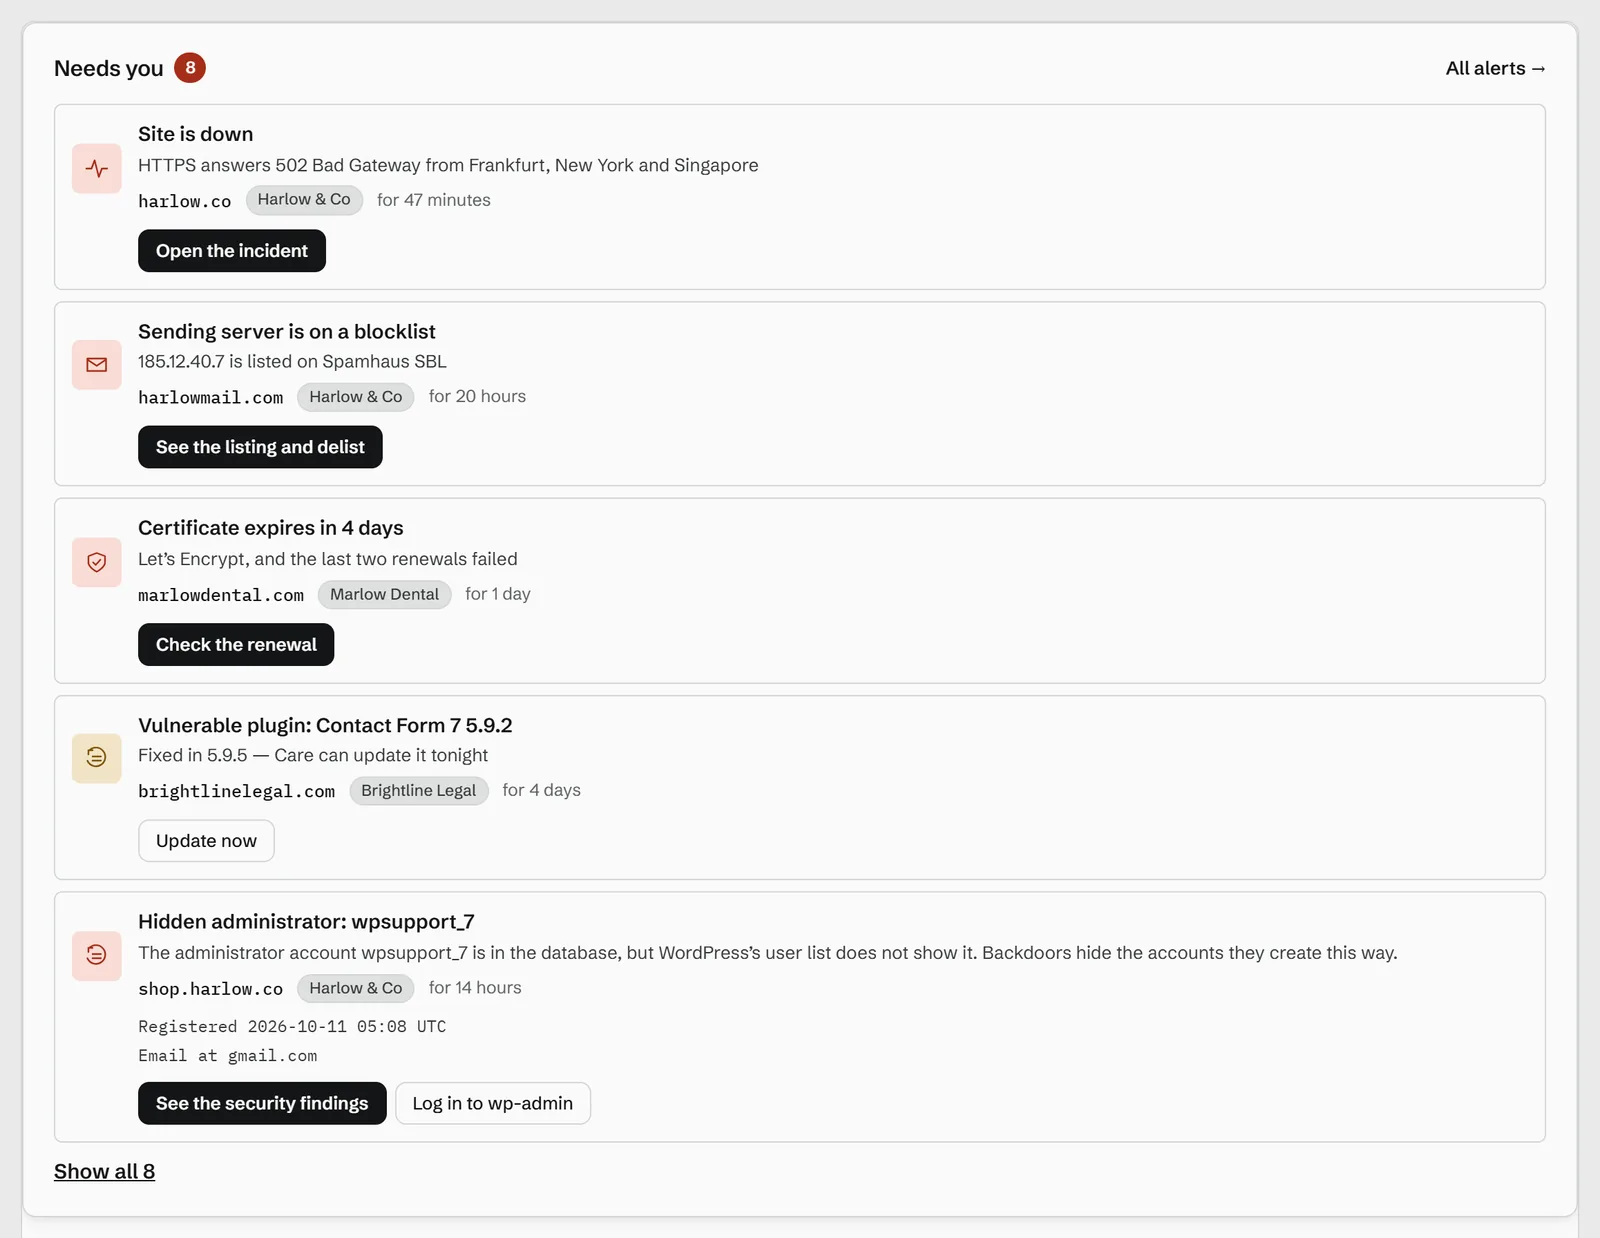
Show all under the list opens the rest. On the Agency and Enterprise plans, with a workspace for each client, Showing at the top switches between all workspaces and one, and the list follows.
Step 2: Open the domain
Every domain’s overview starts with a row of tiles. To fix counts what needs attention on that domain, by severity; the others say whether it is up, what expires next and what changed last:
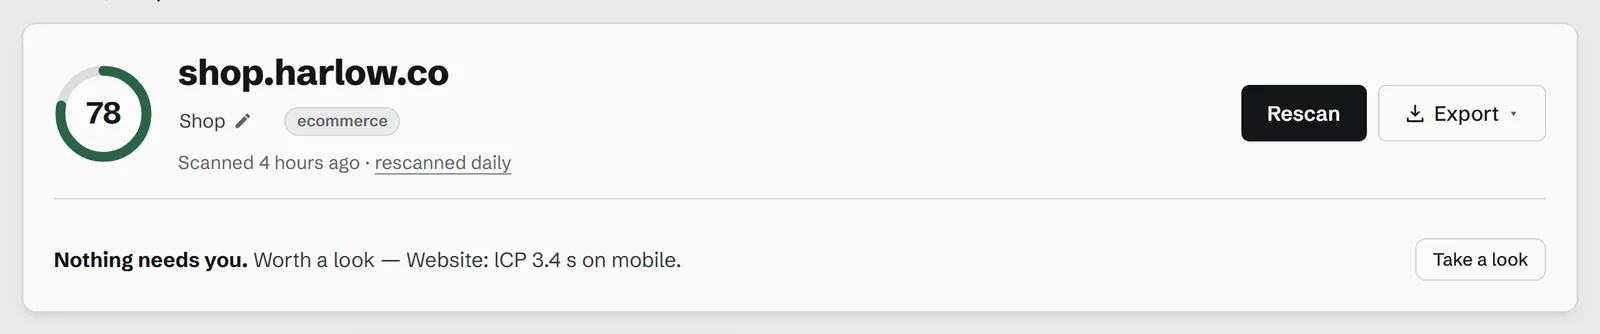
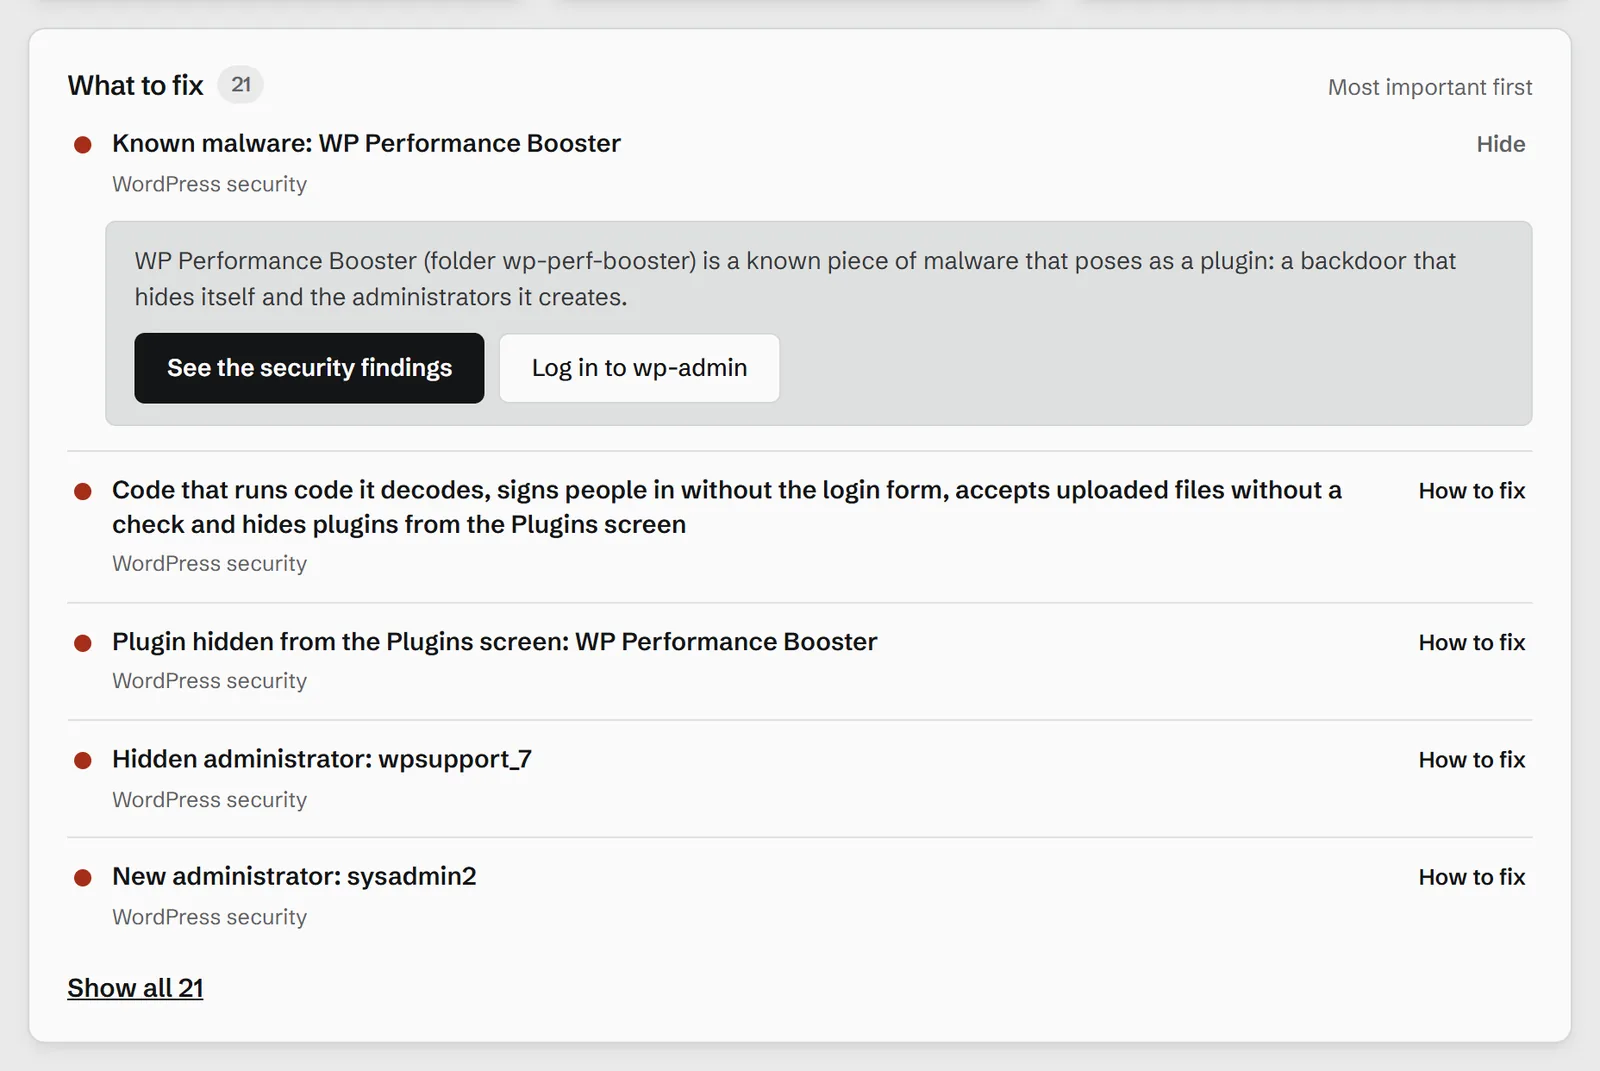
Further down, What to fix lists them, most important first — the scan’s findings, what the domain’s WordPress sites report and trouble in its watched areas, together. The first item is open; click any other to read it:
Step 3: Fix it from the list
Each open item ends in its buttons. Some act on the spot:
- Check email now sends a test message through the WordPress site’s own mail setup, and the result follows within minutes.
- Read it now or Read it again reads the WordPress site at once — after you have fixed WP-Cron, say, or reconnected a site that could not be read.
- Log in to wp-admin signs you in to the site with a one-time link, to fix what needs fixing there.
The rest open the screen where the problem is fixed: the incident, the security findings, the updates waiting, the blocklist listing with the steps to get off it.
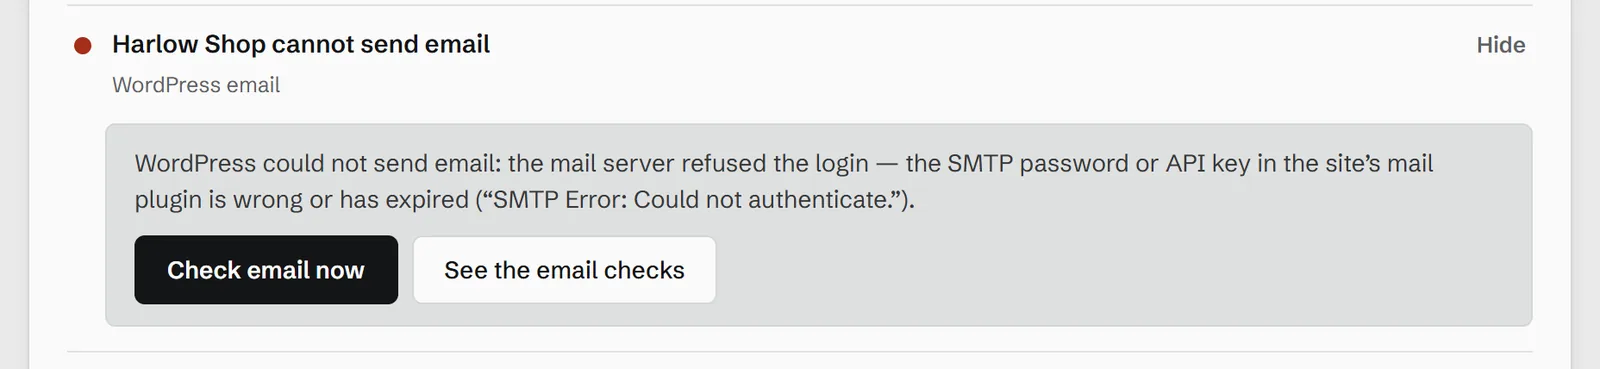
The buttons that act on a site run in the workspace you are in. On an item from another workspace, they take you to that workspace first.
Step 4: The site’s own list
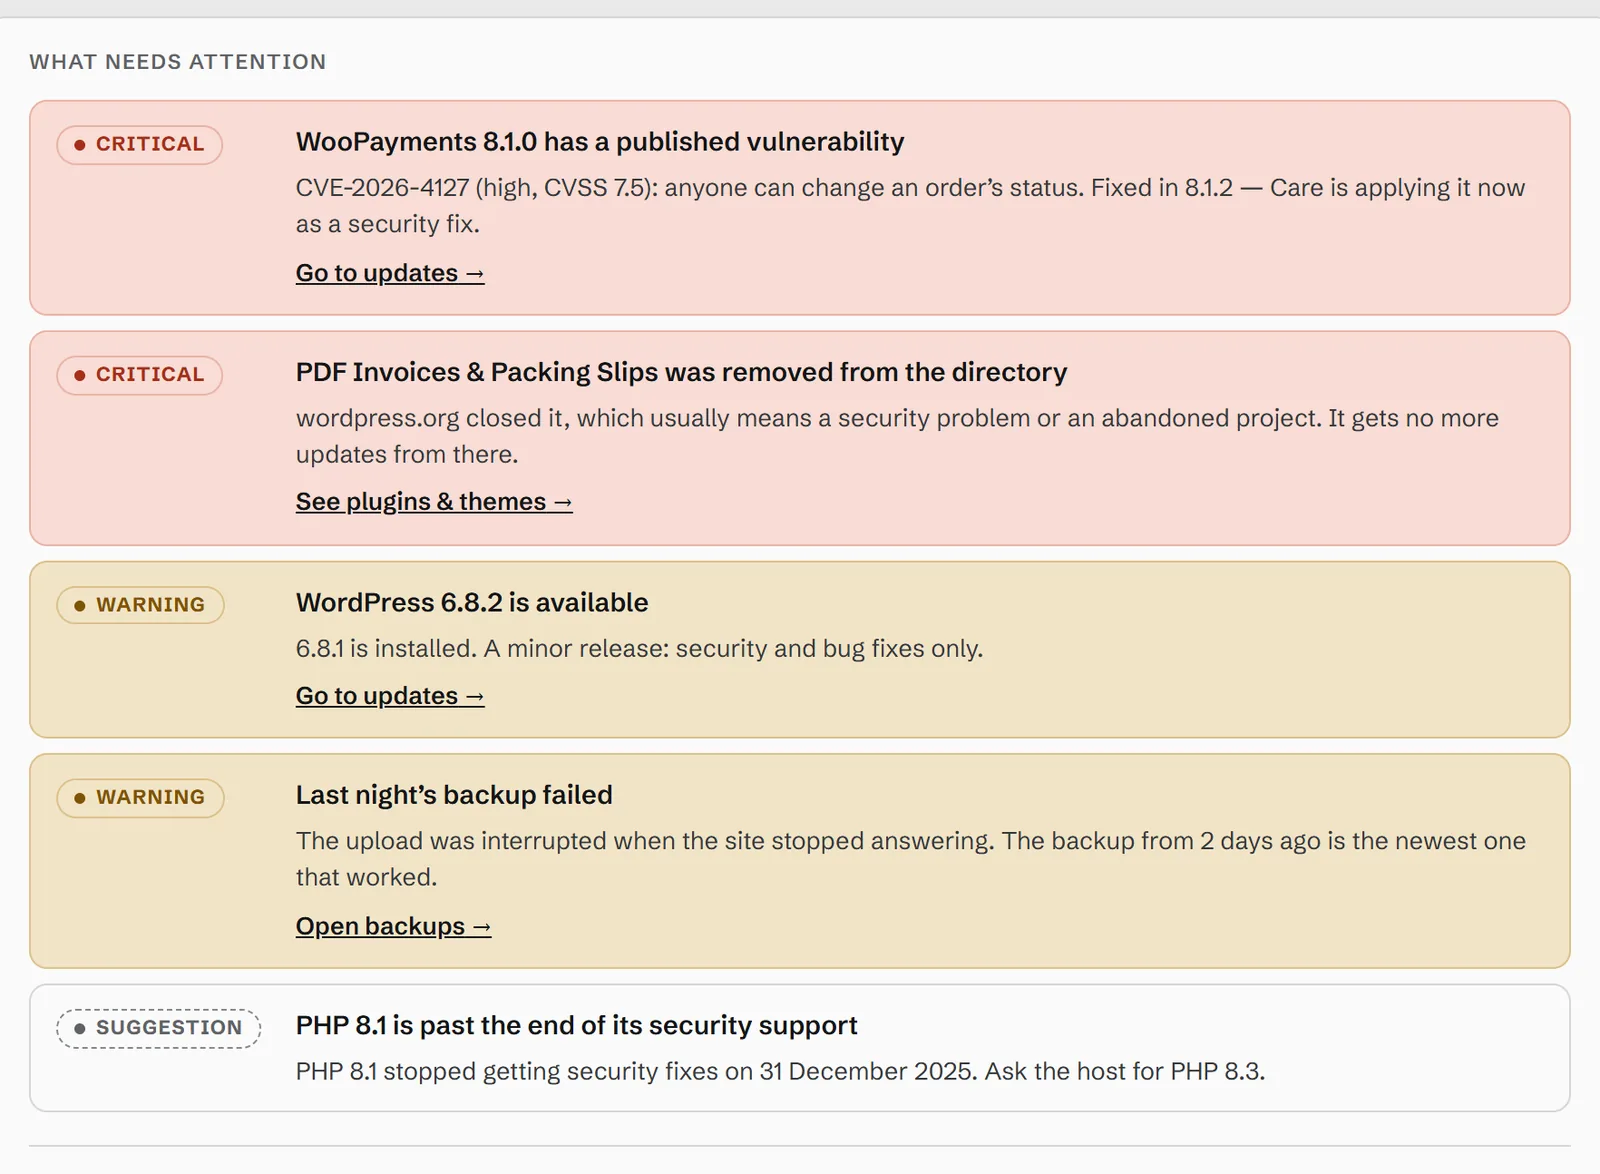
A WordPress site’s page has the same list for that site alone, under What needs attention, each item with a link to the tab that fixes it — the updates, the plugins, the backups:
Alerts still come — once
The list is where you work; alerts are how you find out. Each problem is emailed once when it starts and once when it is over — not at every check — to whoever chose it under Settings → Your alerts, and can go to Slack, Teams, PagerDuty or a webhook from the Personal plan. Teammates can mark an alert I’m on it, so two people never chase the same problem.
The list and the buttons are on every plan, Free included. To try it on your own domains, start free with three domains.